

33 parks · 993 rides · 10 languages
A 40-minute wait — is that a lot ?
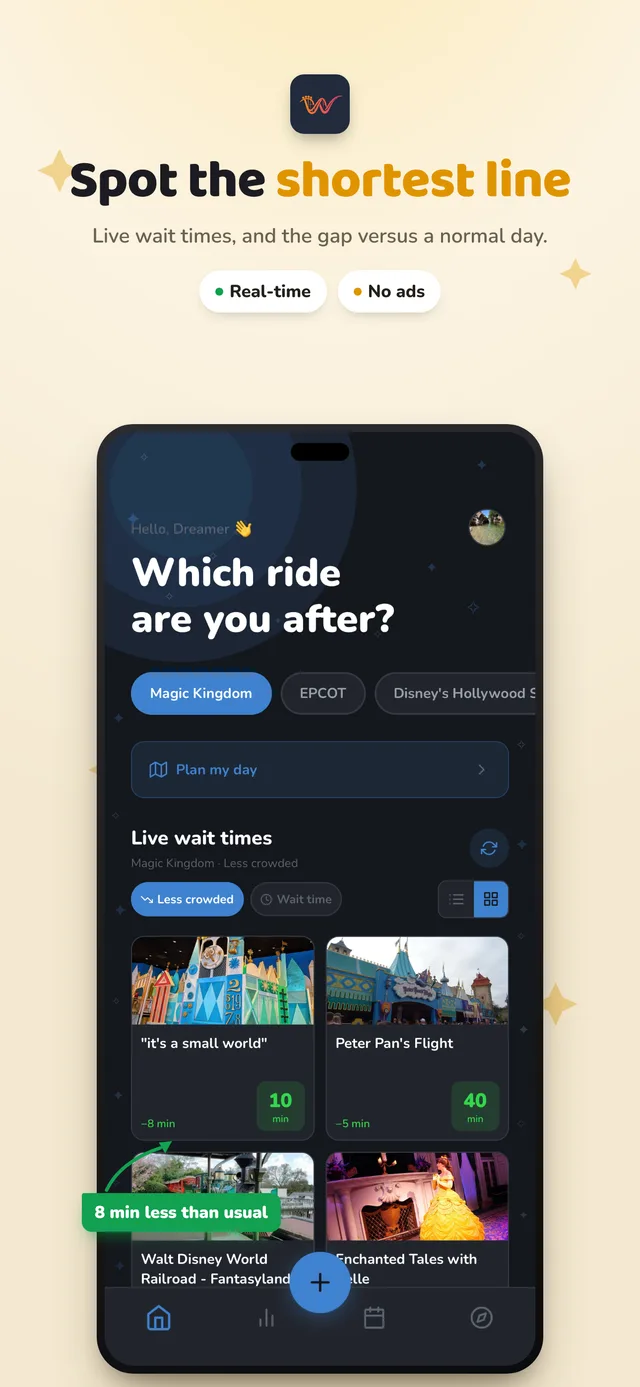
WikiCoaster is an app that compares every queue with what it usually looks like at this hour, on this day. You no longer read "40 min" but "23 minutes shorter than usual" — and you know what to ride first, and in what order.
The parks
33 parks, 993 rides.
From Disneyland Paris to Tokyo DisneySea, every park tracked continuously.
 Magic KingdomOrlando, United States · 30 rides
17minon average
Disneyland (Californie)Anaheim, United States · 35 rides
17minon average
Magic KingdomOrlando, United States · 30 rides
17minon average
Disneyland (Californie)Anaheim, United States · 35 rides
17minon average
 Tokyo DisneylandUrayasu, Japan · 32 rides
20minon average
Tokyo DisneylandUrayasu, Japan · 32 rides
20minon average
 Shanghai DisneylandShanghai, China · 26 rides
28minon average
Tokyo DisneySeaUrayasu, Japan · 28 rides
37minon average
EPCOTOrlando, United States · 16 rides
26minon average
Disney's Hollywood StudiosOrlando, United States · 10 rides
34minon average
Shanghai DisneylandShanghai, China · 26 rides
28minon average
Tokyo DisneySeaUrayasu, Japan · 28 rides
37minon average
EPCOTOrlando, United States · 16 rides
26minon average
Disney's Hollywood StudiosOrlando, United States · 10 rides
34minon average
 Disneyland ParisMarne-la-Vallée, France · 24 rides
20minon average
Universal Islands of AdventureOrlando, United States · 17 rides
19minon average
Disney California AdventureAnaheim, United States · 22 rides
20minon average
Universal Studios FloridaOrlando, United States · 13 rides
21minon average
Disney's Animal KingdomOrlando, United States · 9 rides
22minon average
Disneyland ParisMarne-la-Vallée, France · 24 rides
20minon average
Universal Islands of AdventureOrlando, United States · 17 rides
19minon average
Disney California AdventureAnaheim, United States · 22 rides
20minon average
Universal Studios FloridaOrlando, United States · 13 rides
21minon average
Disney's Animal KingdomOrlando, United States · 9 rides
22minon average
 Hong Kong DisneylandLantau, Hong Kong SAR China · 20 rides
20minon average
Hong Kong DisneylandLantau, Hong Kong SAR China · 20 rides
20minon average
 Europa-ParkRust, Germany · 39 rides
11minon average
Europa-ParkRust, Germany · 39 rides
11minon average
 EftelingKaatsheuvel, Netherlands · 26 rides
17minon average
Disney Adventure WorldMarne-la-Vallée, France · 13 rides
31minon average
Epic UniverseOrlando, United States · 12 rides
35minon average
EftelingKaatsheuvel, Netherlands · 26 rides
17minon average
Disney Adventure WorldMarne-la-Vallée, France · 13 rides
31minon average
Epic UniverseOrlando, United States · 12 rides
35minon average
 PortAventuraSalou, Spain · 29 rides
25minon average
PhantasialandBrühl, Germany · 32 rides
15minon average
PortAventuraSalou, Spain · 29 rides
25minon average
PhantasialandBrühl, Germany · 32 rides
15minon average
 Alton TowersAlton, United Kingdom · 37 rides
20minon average
Alton TowersAlton, United Kingdom · 37 rides
20minon average
 GardalandCastelnuovo del Garda, Italy · 28 rides
11minon average
Parc AstérixPlailly, France · 37 rides
14minon average
Thorpe ParkChertsey, United Kingdom · 21 rides
21minon average
GardalandCastelnuovo del Garda, Italy · 28 rides
11minon average
Parc AstérixPlailly, France · 37 rides
14minon average
Thorpe ParkChertsey, United Kingdom · 21 rides
21minon average
 LisebergGöteborg, Sweden · 40 rides
15minon average
Walibi HollandBiddinghuizen, Netherlands · 14 rides
14minon average
Heide ParkSoltau, Germany · 37 rides
10minon average
FuturoscopePoitiers, France · 13 rides
24minon average
ToverlandSevenum, Netherlands · 36 rides
7minon average
LisebergGöteborg, Sweden · 40 rides
15minon average
Walibi HollandBiddinghuizen, Netherlands · 14 rides
14minon average
Heide ParkSoltau, Germany · 37 rides
10minon average
FuturoscopePoitiers, France · 13 rides
24minon average
ToverlandSevenum, Netherlands · 36 rides
7minon average
 Plopsaland BelgiumDe Panne, Belgium · 39 rides
11minon average
Movie Park GermanyBottrop, Germany · 27 rides
13minon average
Paultons ParkRomsey, United Kingdom · 33 rides
12minon average
Parque Warner MadridSan Martín de la Vega, Spain · 30 rides
12minon average
Plopsaland DeutschlandHaßloch, Germany · 33 rides
5minon average
Plopsaland BelgiumDe Panne, Belgium · 39 rides
11minon average
Movie Park GermanyBottrop, Germany · 27 rides
13minon average
Paultons ParkRomsey, United Kingdom · 33 rides
12minon average
Parque Warner MadridSan Martín de la Vega, Spain · 30 rides
12minon average
Plopsaland DeutschlandHaßloch, Germany · 33 rides
5minon average
No park matches.
The app
Free — except what builds your day.
Wait times, the gap to normal and park crowd levels for all 33 parks are free, forever. Plus is bought once and adds planning, alerts and forecasts.
Free
no paid account- Live wait times for all 33 parksDisneyland Paris, Walt Disney World, Universal Orlando, Europa-Park, Efteling, Phantasialand, PortAventura, Parc Astérix, Alton Towers and many more.
- The gap to normal on every rideThe one piece of information that tells you what to do now.
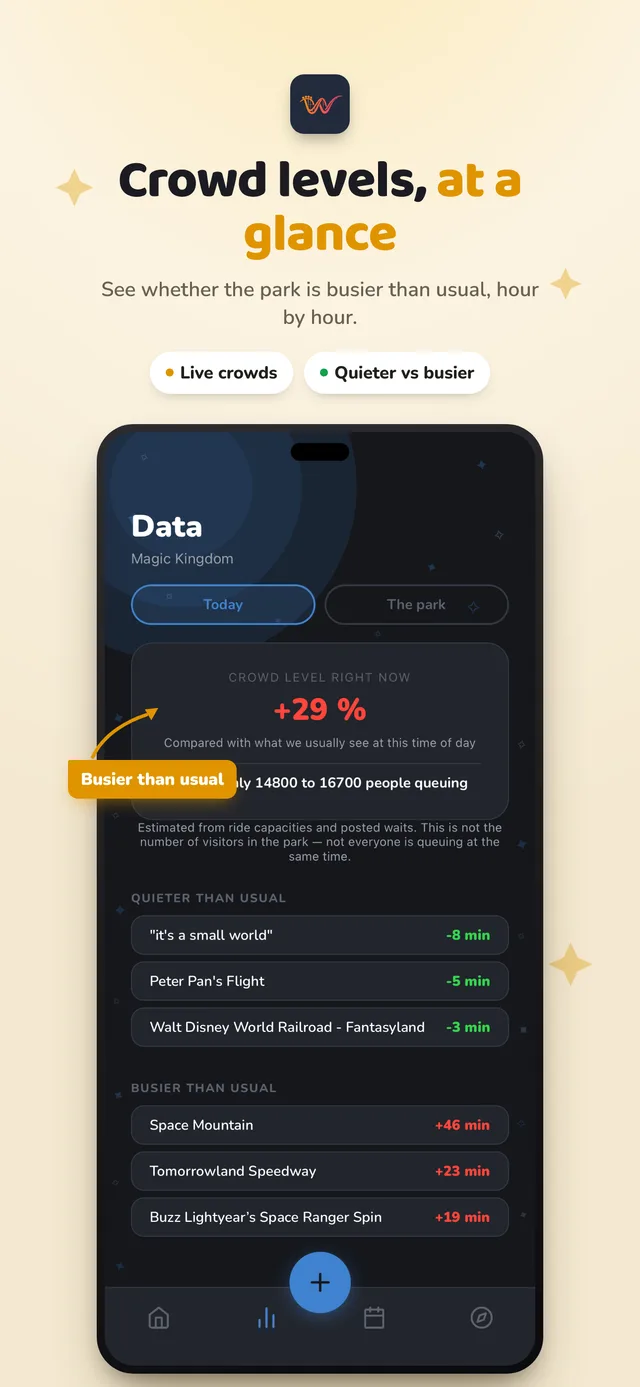
- Live park crowd levelsAnd how many people are actually standing in the queues.
- Rides quieter than usualAnd the ones to avoid in the coming hour.
- My dayYour wish list sorted by "now is the moment", and what you have already done.
- Visitor reviewsOn every ride.
WikiCoaster Plus
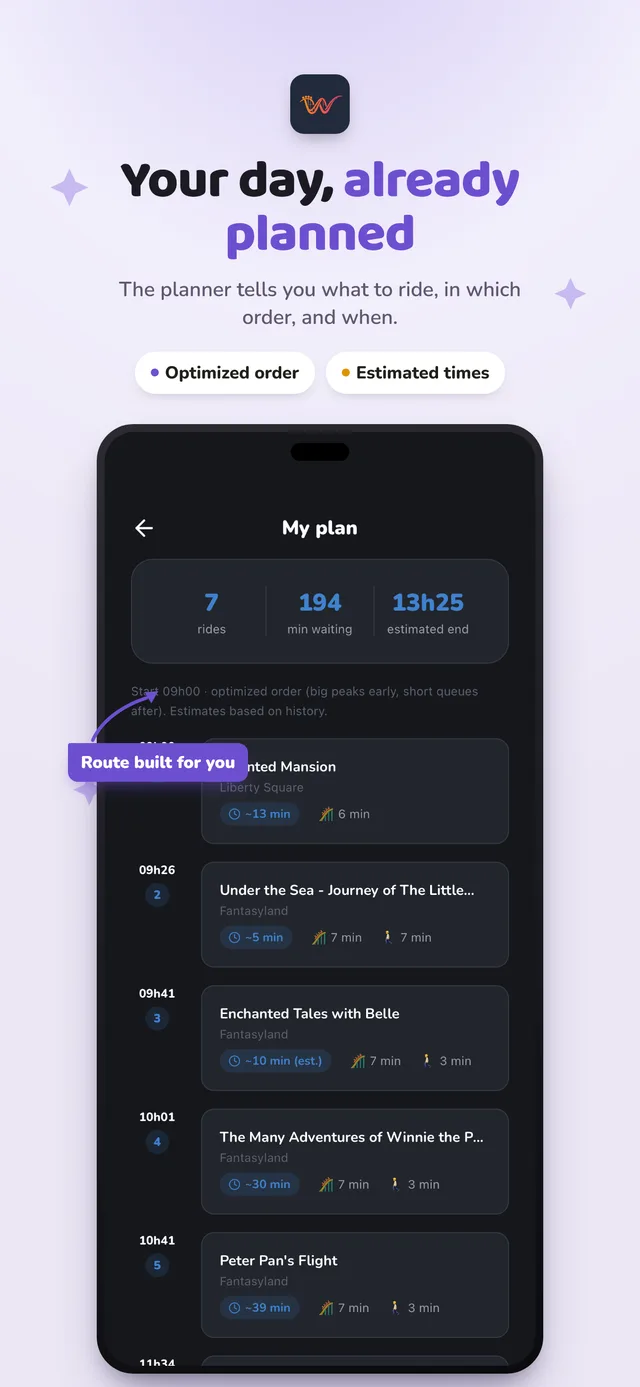
€4.99 once- Plan my dayYou give the ages of your group and the kind of rides you want. We put them in the best order, with walking times and your breaks.
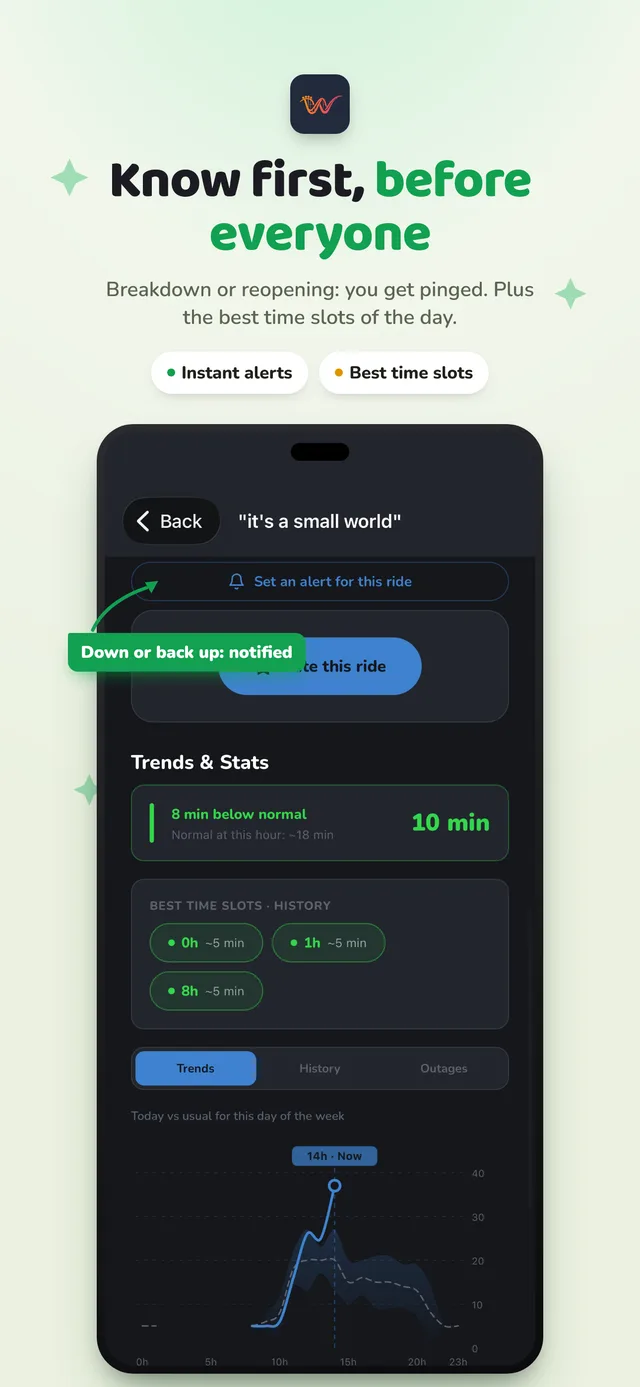
- AlertsGet notified when a ride drops below your wait threshold, breaks down, or reopens.
- Today's curve and forecastsThe wait hour by hour today, and above all what is coming before closing time. Plus 7 days of history.
- Consistency and reliability of every rideWhich ones keep to their posted time, which are unpredictable, and which break down often.
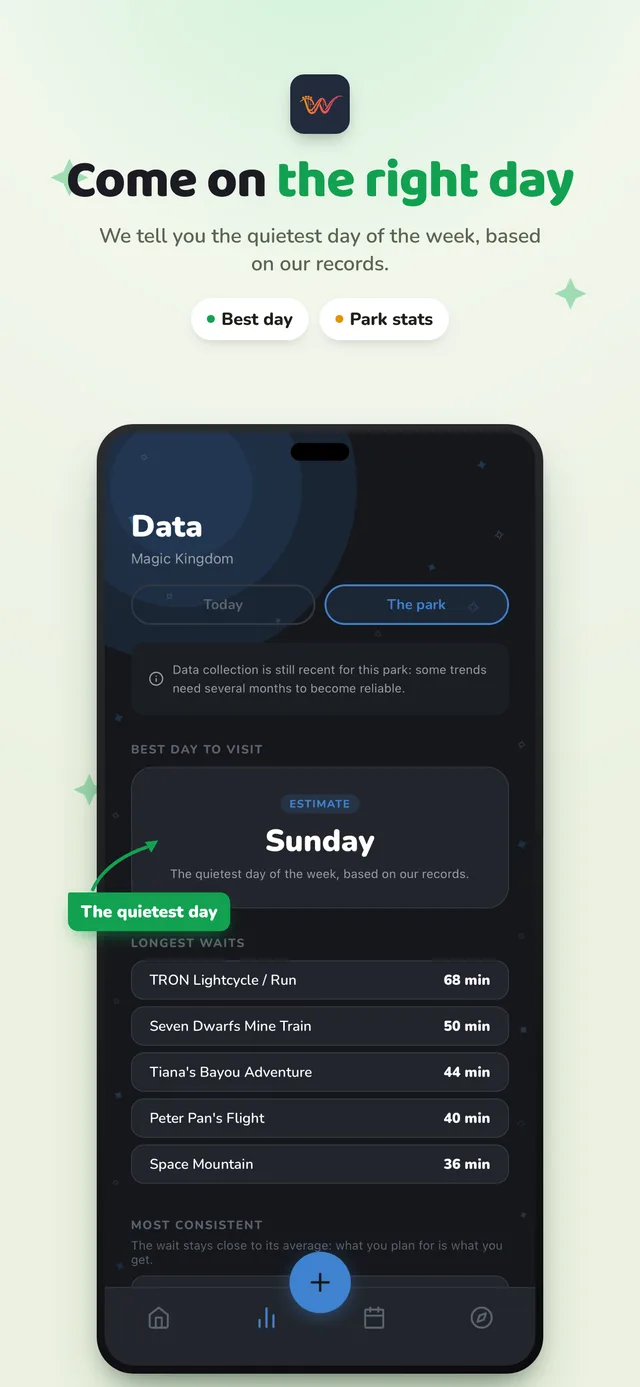
- Data for all 33 parks, not just oneThe best day to visit and the longest waits, everywhere, in your pocket.
No subscription, no renewal. You pay once, it is unlocked forever, on all your devices. No ads.
How it works
A number on its own
says nothing.
We have been recording wait times continuously for months. That history is what lets us say what is normal — and therefore spot what is not. When a figure rests on too few readings, it is shown as an estimate, or not shown at all.
On every page
The questions people type, answered.
Every park and every ride has its page, built on months of readings.
Which day to visit
All seven days ranked from quietest to busiest, with the average wait for each.
What time
The shape of the day, from the morning lull to the afternoon peak.
Where the waits are
The park's queues ranked, averaged over the whole recording period.
The best moment
For every ride, the slots where the queue is shortest.
What this site cannot do.
These pages tell you what is normal. The app is with you inside the park — and that is where your day is won.
Live wait times for every ride. On iOS, no subscription, no ads.
- Live waits for all 33 parks, and the gap to normal
- The forecast to closing time, not just the current hour
- An itinerary built for your group: ages, tastes, breaks
- An alert as soon as a queue drops below your threshold
- The consistency and reliability of every ride
- The detail day by day, hour by hour